
An integral can represent the area of a region between two curves, but only after the region is described as a stack of simple slices. With vertical slices, each slice has height equal to top function minus bottom function. With horizontal slices, each has width equal to right function minus left function. The correct variable and subtraction order come from the geometry, not from a memorized formula.
This lesson turns a picture into an integral deliberately. We will locate intersections, decide whether vertical or horizontal slicing produces one consistent expression, and split the region when the boundary roles change. The goal is a nonnegative geometric area, so every piece must use larger coordinate minus smaller coordinate.
By the end, you should write a valid area-between-curves integral, explain its bounds and integrand, and recognize when one integral must be split. You should not confuse signed integral value with geometric area. The next lesson extends the same cross-section logic from planar regions to volumes.
Vertical slices use top minus bottom
If lies above on , then the area between them is
Each thin vertical rectangle has width and height . Height times width has square units. The formula is not simply “subtract the second equation from the first”; the upper curve must be subtracted from the lower in the order that gives positive slice heights.
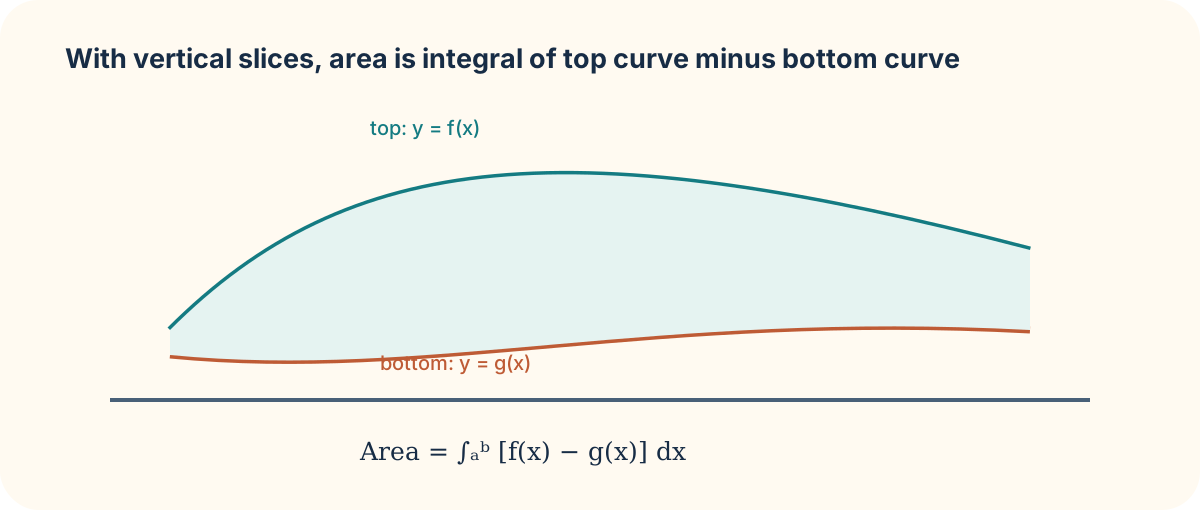
For the curves and on , the line is above the parabola because there. Thus the area is . Check an interior test point such as if the top curve is not visually obvious. The intersection points provide natural bounds because the slice height becomes zero there.
Split when the boundary changes
If curves cross inside the region, the top and bottom functions switch roles. One unbroken subtraction order would produce a negative contribution on one side, which is inappropriate for geometric area. Split at each intersection and write a separate positive-height integral for each interval.
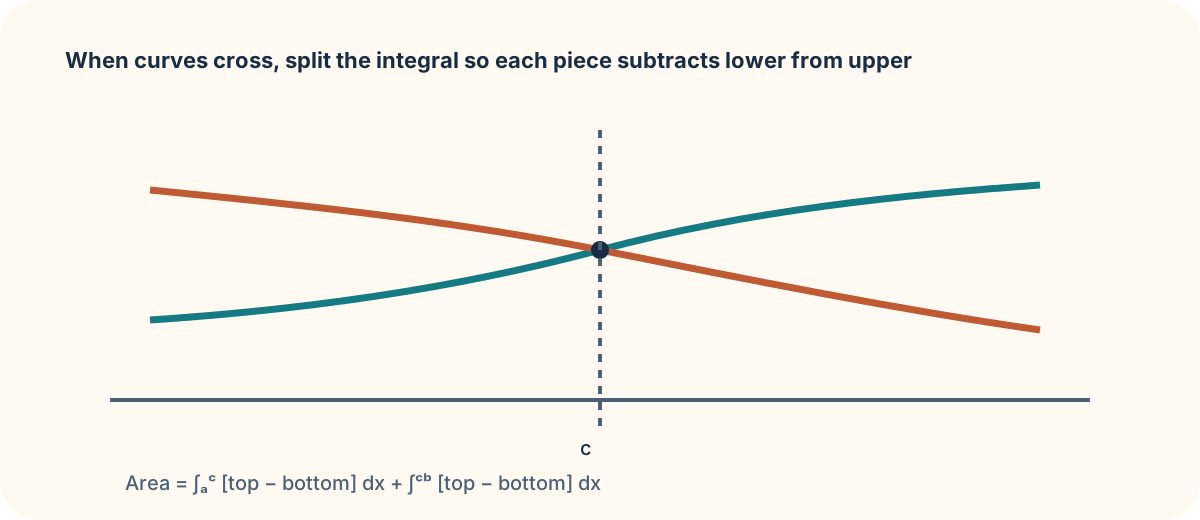
Suppose is above on but is above on . Then
The split is not a technical nuisance. It records a real change in the geometry. A sign chart for can identify which curve is on top and where the sign changes. This is the same interval-analysis habit used for derivative signs earlier in the course.
Horizontal slices use right minus left
Sometimes vertical slices force inverse functions, multiple pieces, or difficult bounds. A horizontal slice may be simpler. If is the right boundary and is the left boundary for from to , then
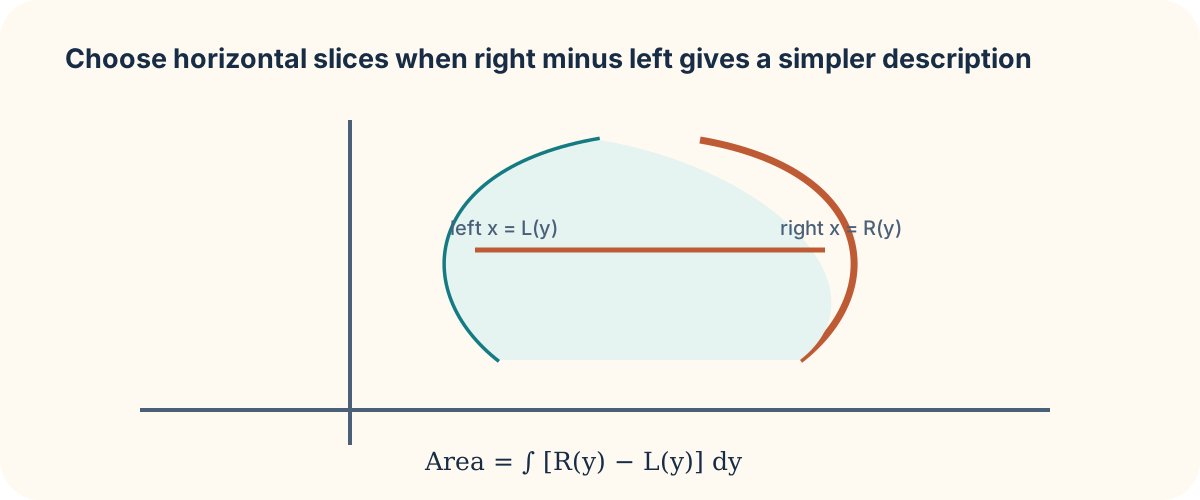
Choose the direction that gives one clear slice description. Do not choose merely because an equation is written with y, or merely because x is familiar. Sketch at least one representative slice and label its width or height. The slice itself tells you the integrand.
Verify the geometric meaning
Area must be nonnegative and has squared units. If the computed answer is negative, revisit top-bottom or right-left order. If a region is not actually bounded by the stated curves and bounds, determine what additional boundary is intended before integrating. A graph or a table of intersections can test the setup, but the integral should be justified from the slice geometry.
Practice by finding the area enclosed by and . Then choose horizontal slices and write an alternative setup; compare which is simpler. Finally, consider two curves that cross twice and identify every interval where their order changes. The next lesson applies the same idea of summing thin slices in a new dimension to calculate volume.