
Light produces interference and diffraction, so wave descriptions are indispensable. Yet when light exchanges energy with matter, the exchange occurs in discrete packets called photons. The photoelectric effect exposed this quantization by showing that electron emission depends on light frequency in a way classical intensity arguments could not explain. Below a material-specific threshold frequency, increasing brightness does not eject electrons. Above threshold, emission begins promptly and electron kinetic energy rises with frequency.
These observations do not force a choice between “light is only a wave” and “light is only a particle.” Quantum theory preserves wave phenomena while describing localized energy and momentum exchanges. The useful question is which model feature predicts the measurement being made. This lesson builds Einstein’s photoelectric equation from energy conservation, connects it to stopping potential and graphs, and separates frequency effects from intensity effects. Every formula will be interpreted through units and an explicit energy ledger.
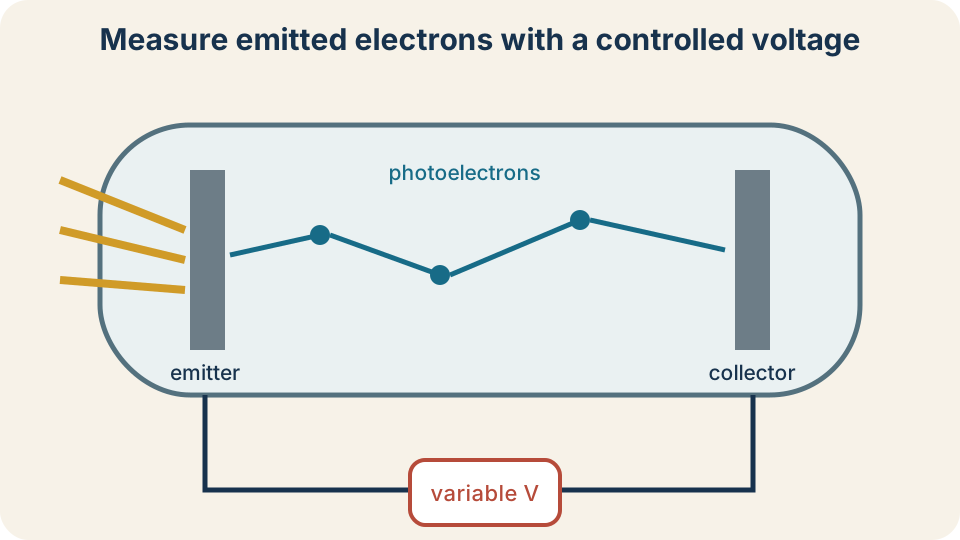
Photons strike a clean metal surface in an evacuated apparatus. An electron must receive enough energy to overcome the material’s work function. Any energy beyond that requirement can appear as electron kinetic energy. A collecting electrode measures emitted charge as current. A reverse voltage can stop even the fastest emitted electrons.
Begin with the classical puzzle
In a classical electromagnetic wave, intensity measures average energy delivered per unit area per unit time. A brighter wave carries more energy toward the surface. One might therefore expect sufficiently intense light of any frequency eventually to eject electrons. One might also expect a delay while an electron accumulates enough continuously delivered energy. Those predictions do not match the central photoelectric observations.
Experiments show a threshold frequency for each material. Light with does not eject photoelectrons in the idealized one-photon effect, even if its intensity is increased greatly. Light with can produce emission without a detectable classical charging delay. The maximum electron kinetic energy depends on frequency rather than intensity. Increasing above-threshold intensity mainly increases the number of emitted electrons per unit time.
A theory must explain all observations together. Saying only that light “has energy” does not distinguish continuous delivery from packet delivery. The photon model assigns energy to each individual interaction. Frequency determines energy per photon, while intensity influences photon arrival rate under fixed-frequency conditions. This separation resolves the apparently contradictory roles of brightness and color.
Define photon energy and momentum
A photon of frequency has energy . The symbol denotes photon energy, and the subscript Greek gamma commonly labels a photon. Planck’s constant is exactly in SI units. Frequency has units , also called hertz. Multiplying joule-seconds by reciprocal seconds gives joules.
For light in vacuum, speed, frequency, and wavelength satisfy . The symbol is the vacuum light speed, , and is wavelength in metres. Substituting gives . Shorter wavelength corresponds to higher frequency and greater photon energy. Longer wavelength corresponds to lower photon energy.
A photon also carries momentum . Momentum units follow as . Photons have zero rest mass but nonzero energy and momentum. Their momentum can exert radiation pressure or participate in collision conservation. The photoelectric energy ledger emphasizes energy, but momentum conservation remains part of the full interaction.
Use electronvolts without losing unit meaning
Atomic-scale energies are often expressed in electronvolts. One electronvolt is the energy gained by a charge of magnitude moving through a potential difference of . Numerically, . The unit is an energy unit, not a voltage unit. Writing a photon energy as is therefore dimensionally legitimate.
A convenient wavelength relation is . If wavelength is given in nanometres, photon energy becomes . Nanometres cancel and electronvolts remain. For , the energy is approximately . The same result can be converted to joules when SI base calculations require it.
Unit consistency determines which constant form to use. Using in joule-seconds produces energy in joules when frequency is in reciprocal seconds. Using produces electronvolts when wavelength is in nanometres. Mixing metres with the nanometre constant introduces a factor of error. Write units through the fraction rather than appending them only at the end.
Define the work function
An electron in a material is bound by interactions with the solid. The minimum energy needed to remove an electron from the surface is the work function, written . The Greek lowercase letter phi labels this material property. Work functions are commonly a few electronvolts for metals. Surface composition, crystal face, contamination, and treatment can affect the measured value.
The work function is an energy requirement rather than a force. It plays the role of an escape cost in the photoelectric ledger. A photon with cannot eject an electron through the ideal one-photon process. At , an electron at the most favorable initial state can just escape with zero maximum kinetic energy. Above that energy, the excess can become motion.
Real solids contain electrons with a distribution of initial energies and directions. Collisions inside the material can reduce the kinetic energy measured outside. Therefore emitted electrons have a range of kinetic energies even under monochromatic illumination. The work-function equation predicts the maximum kinetic energy for the most favorably emitted electrons. It does not claim that every electron leaves with that maximum.
Build Einstein’s photoelectric equation
Energy conservation assigns the incoming photon energy to escape energy and outgoing electron kinetic energy. For the maximum-energy electrons, . Rearranging gives . The symbol denotes maximum photoelectron kinetic energy. Every term is an energy and must use compatible units.
If , the algebra gives a negative value, but negative kinetic energy is not the physical result. Instead, no photoelectron emission occurs in the ideal one-photon model. If , the maximum kinetic energy is zero at threshold. If , emission is energetically allowed. The piecewise interpretation matters as much as the subtraction.
The equation assumes one photon transfers its energy in one electron interaction. Increasing frequency raises energy per photon and therefore raises linearly. Increasing intensity at fixed frequency does not change . It changes how many photons arrive, so it changes potential emission rate rather than the maximum kinetic energy. This distinction is the conceptual center of the photoelectric effect.
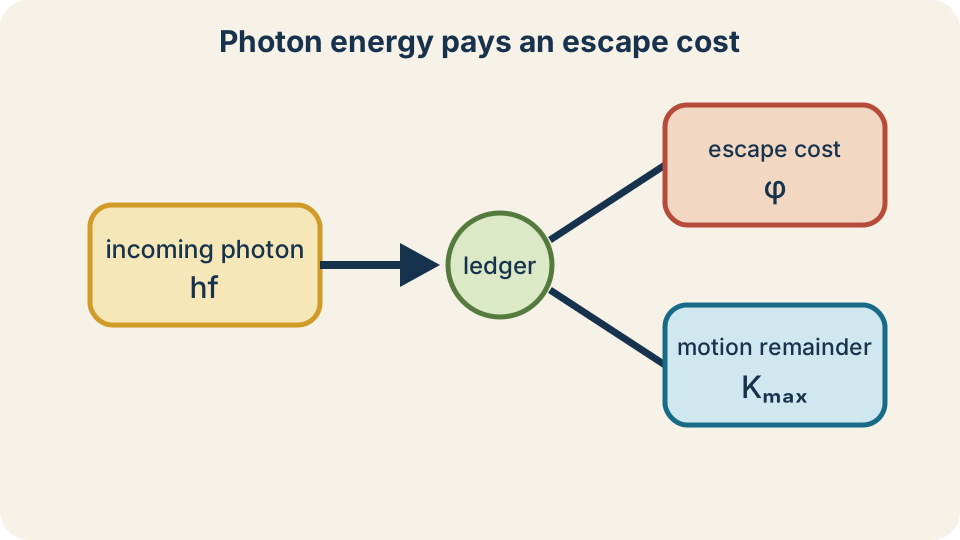
The photon brings energy . The work function is the minimum escape cost. The remainder becomes maximum electron kinetic energy. Below threshold, the ledger cannot pay the escape cost and emission does not occur. Above threshold, greater frequency increases the remainder. The ledger expresses energy conservation for one photon interaction.
Derive threshold frequency and wavelength
At threshold, . Substituting into Einstein’s equation gives . Therefore the threshold frequency is . Frequencies below are insufficient in the ideal model. Frequencies above it can eject photoelectrons.
Using , the threshold wavelength is . Because frequency and wavelength are inversely related, emission occurs for but for . The inequality reverses when changing from frequency to wavelength. A shorter wavelength has more energy per photon. Forgetting this reversal is a common reasoning error.
Suppose a metal has . Its threshold wavelength is to three significant figures. Light at has lower photon energy and will not eject electrons ideally. Light at has higher photon energy and can. The numerical result should always be paired with the correct inequality.
Measure maximum kinetic energy with stopping potential
A photoelectric tube can place a reverse voltage between emitter and collector. The electric field then opposes emitted electrons. As the reverse voltage magnitude grows, fewer electrons reach the collector. At the stopping potential , even the fastest photoelectrons are just prevented from arriving. The photocurrent falls to zero under the idealized measurement definition.
Electric potential energy change for charge magnitude across stopping-potential magnitude is . Equating it to the maximum kinetic energy gives . If kinetic energy is expressed in electronvolts, its numerical value equals the potential in volts for a single electron. Thus corresponds to a stopping-potential magnitude of . This convenience follows from the definition of the electronvolt.
The sign of electron charge can complicate circuit equations, so introductory problems often request the stopping-potential magnitude. State the chosen polarity and distinguish potential from potential-energy change. A volt is a joule per coulomb, written . Multiplying by coulombs gives joules. Dimensional analysis confirms that is an energy.
Work a stopping-potential example
A material with work function is illuminated by photons of energy . Einstein’s equation gives . The result is positive, so emission is allowed. It is a maximum rather than the energy of every emitted electron. Less favorable electrons can emerge with smaller energies.
Using , the stopping-potential magnitude is . In SI units, the energy is . Dividing by elementary charge in coulombs returns . The unit path confirms the numerical shortcut. Reporting only “1.50” would leave the physical quantity ambiguous.
If intensity increases at the same photon energy, the stopping potential remains essentially unchanged. More electrons may be emitted per second, increasing saturation current. The fastest electron still receives no more than the same photon energy minus the same work function. If frequency increases instead, stopping potential rises. These different experimental responses allow frequency and intensity effects to be distinguished.
Interpret current–voltage behavior
At a positive collecting voltage, emitted electrons are attracted toward the collector. As voltage becomes sufficiently favorable, nearly every emitted electron that can reach the collector is collected. The current approaches a saturation value. Increasing light intensity at fixed above-threshold frequency increases photon arrival rate and generally increases this saturation current. It does not shift the stopping voltage if the frequency is unchanged.
When the collector is made negative relative to the emitter, it repels electrons. Lower-energy electrons turn back first. Increasing the reverse-potential magnitude progressively excludes faster electrons. At the stopping value, the ideal photocurrent reaches zero. This curve reveals an energy distribution rather than a single kinetic energy for all photoelectrons.
Experimental details matter near the endpoints. Contact potentials, dark currents, surface contamination, and instrument resolution can shift or blur a measured curve. Introductory models treat these as controlled corrections. The core inference remains that stopping potential measures the maximum energy scale. Saturation current primarily measures an emission-rate scale.
Read the kinetic-energy versus frequency graph
Plotting vertically against frequency horizontally gives a straight line above threshold. Einstein’s equation has slope–intercept form . The slope is Planck’s constant . The vertical intercept of the extended line is . The horizontal intercept is .
Different materials have different work functions, so their lines have different intercepts. Under the model, they share the same slope because Planck’s constant is universal. A larger work function shifts the threshold to a higher frequency. Experimental slope measurements provided a quantitative test of the photon relation. The graph turns an abstract constant into a measurable rate of energy increase per frequency increase.
If stopping potential is plotted instead, substitute . The result is . The slope is then with units volt-seconds. The threshold frequency remains the same horizontal intercept. Axis labels determine which constant a measured slope represents.
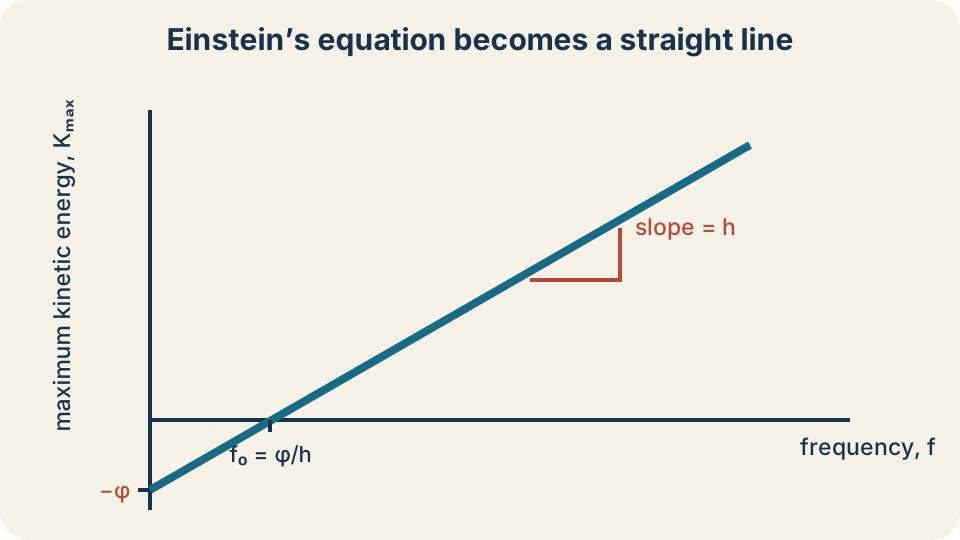
Above threshold, maximum kinetic energy increases linearly with frequency. The slope is Planck’s constant when energy is plotted against frequency. The negative vertical intercept encodes the work function. The horizontal intercept is the threshold frequency. Increasing intensity does not move this ideal line. Only above-threshold data represent emitted photoelectrons.
Separate frequency from intensity
Frequency describes oscillations per second and determines energy per photon through . Intensity describes average power per area, commonly in . At fixed frequency, a higher intensity usually corresponds to more photons arriving per unit area per unit time. Each photon still has the same individual energy. The surface therefore receives more interaction opportunities without increasing energy per event.
Above threshold, greater intensity generally increases the number of photoelectrons and hence the photocurrent. Maximum kinetic energy remains set by photon energy minus work function. Greater frequency increases maximum kinetic energy and may alter emission probability depending on material response. If frequency crosses from below to above threshold, emission begins. These are distinct experimental controls with distinct outcomes.
Below threshold, arbitrarily increasing intensity does not create the ideal one-photon photoelectric effect. At extremely high intensities, multiphoton processes can occur, but that is a different nonlinear regime. Foundational problems assume ordinary one-photon interactions unless told otherwise. Stating the model prevents a sophisticated exception from being used to erase the basic result. Scientific rules are always attached to conditions.
Understand what the experiment establishes
The photoelectric effect demonstrates quantized energy exchange between light and matter. The threshold and linear energy–frequency relation support photon energy . Prompt emission follows because one photon can transfer the required energy in one interaction. Intensity controls event rate at fixed frequency because it changes photon flux. These observations contradict a simple continuous-energy-delivery explanation.
The experiment does not eliminate wave behavior. Diffraction, interference, and polarization remain central properties of light. Quantum electrodynamics describes detection events and propagation probabilities without reducing light to classical billiard balls. “Wave–particle duality” is a historical phrase for this refusal to fit classical categories completely. The quantum description predicts which behavior appears in each measurement arrangement.
The experiment also does not show that every electron in a material has identical binding energy or outgoing speed. The work function is a surface escape threshold, and actual electron distributions broaden outcomes. Einstein’s equation identifies the maximum kinetic-energy boundary. A good model isolates the robust relationship while acknowledging real-material structure. Precision about what was measured prevents overclaiming.
Follow an error-resistant workflow
First convert wavelength to photon energy or use the given frequency. Keep units consistent and label the result . Second compare it with the work function . If , state that ideal one-photon emission does not occur. If , subtract to find .
Next convert maximum kinetic energy to stopping-potential magnitude if requested. In electronvolt units, the numerical value in electronvolts equals the value in volts for one electron. In joules, use . Distinguish the charge magnitude from the signed electron charge . Report the polarity convention if circuit direction matters.
Finally perform qualitative checks. Shorter wavelength should mean greater photon energy. Higher frequency above threshold should mean greater maximum kinetic energy. Greater intensity at fixed frequency should mainly change electron rate, not the stopping potential. A negative subtraction signals no ideal emission rather than negative kinetic energy.
Repair common misconceptions
Brightness does not determine energy per photon when frequency is fixed. It primarily changes the number of photons delivered per time and area. Color or frequency determines each photon’s energy. A dim ultraviolet beam can eject electrons from a material that a bright red beam cannot. The ultraviolet photons can individually exceed the work function.
Threshold frequency is a minimum, whereas threshold wavelength is a maximum. Because , increasing one decreases the other. Writing both inequalities prevents a verbal reversal. Another error is to subtract photon energy from work function. The available remainder is incoming energy minus escape cost, .
Stopping potential measures maximum kinetic energy, not average kinetic energy. Emitted electrons can have lower energies because of initial-state differences and collisions. A zero current at stopping voltage does not mean electrons were never emitted. It means they were prevented from reaching the collector. Apparatus interpretation must accompany the algebra.
Retrieve and connect forward
At fixed above-threshold frequency, greater intensity increases photon arrival rate and usually photoelectron current. It does not raise in the ideal model. A material with work function has threshold photon energy . Its threshold wavelength is approximately . Longer wavelengths lie below threshold.
The photoelectric effect does not eliminate light’s wave behavior. It shows that energy exchange is quantized in photon-sized events. Diffraction measures wave-like probability structure, while photoelectric detection records localized transfers. Both belong to one quantum theory. Classical labels describe partial aspects rather than complete identities.
Photon energy accounting leads directly to atomic energy levels. Atoms absorb and emit photons whose energies match differences between allowed states. The photoelectric work function is an escape threshold from a material, while atomic ionization energy is a related binding threshold for an atom. In each case, conservation separates required energy from remaining kinetic energy. The next lesson uses the same relation to decode spectra.