
Statistical validity begins before a mean, interval, regression, or p-value is calculated. The way observations enter a dataset determines which population claims and causal claims the data can support. Random sampling creates a probability connection between a sample and a target population. Random assignment creates a probability mechanism for comparing treatments. These two forms of randomization solve different problems and must remain distinct throughout an analysis.
Establish the learning goals
By the end of this lesson, you should be able to distinguish populations, samples, parameters, statistics, sampling frames, and experimental units. You will compare simple random, stratified, cluster, multistage, and systematic samples. You will identify undercoverage, nonresponse, voluntary-response, and measurement bias. You will design comparative experiments using control, random assignment, replication, blocking, and blinding. You will also state exactly which conclusions a design justifies.
The lesson emphasizes design logic rather than vocabulary alone. A method’s name matters less than the chance mechanism it actually uses. Calling a sample “random” does not make it random if the selection probabilities are unknown. Calling a study an “experiment” does not support causation unless investigators assign treatments. The operational details determine the inferential scope.
Use four questions whenever data are collected. Who or what is the target population? How were observational units selected? Were treatments imposed, and if so, how were they assigned? Which sources of bias, dependence, or interference remain? These questions should be answered before choosing a statistical procedure.
Define population, sample, parameter, and statistic
A population is the full collection of units about which a study seeks a conclusion. A sample is the subset actually observed. A parameter is a numerical feature of the population, such as its mean or proportion . A statistic is calculated from the sample, such as or . Statistics vary across repeated samples, while a fixed population parameter does not.
The target population must be described operationally. “Voters” could mean registered voters, eligible adults, likely voters, or people who cast ballots in one election. Those groups are not interchangeable. Time and geography may also define the population. Vague populations create vague conclusions even when calculations are precise.
The observational unit is the entity on which measurements are recorded. In a household survey, the unit could be a person or an entire household. In a manufacturing study, it could be a part, batch, or production shift. The level matters because observations within a larger unit may be dependent. Counting measurements is not the same as counting independent units.
Connect the target population to a sampling frame
A sampling frame is the operational list or mechanism from which units can be selected. Ideally, it covers the target population once and only once. A voter-registration list may omit eligible but unregistered adults. A customer database may exclude people who never purchased. The frame determines the population actually reachable by the design.
Undercoverage occurs when some target-population groups are missing or systematically less likely to enter the frame. Overcoverage occurs when ineligible or duplicate units appear. Either problem changes selection probabilities and can bias estimates. A large sample drawn from a defective frame remains defective. Sample size does not create representation for absent groups.
Before sampling, compare the frame with the target definition. Ask which groups are missing, duplicated, outdated, or difficult to contact. Coverage adjustment or supplemental frames may reduce known gaps. Such corrections rely on assumptions and should be documented. The strongest solution is often better frame construction rather than more elaborate analysis afterward.
Understand simple random sampling
A simple random sample of size gives every possible subset of distinct population units the same selection probability. This definition concerns samples, not merely individuals. Drawing names without replacement from a well-mixed population list can implement it. A random-number generator can select indices from the complete frame. Haphazard selection by a person is not equivalent to a probability design.
Suppose a frame contains units. Under simple random sampling, each unit has inclusion probability . The horizontal fraction bar groups sample size over population size. Equal inclusion probabilities help prevent systematic human preference from determining the sample. Randomness does not guarantee a perfectly representative realized sample. It makes departures from the population quantifiable through probability.
Implementation details matter. Random numbers should be generated only after a stable frame is established. Duplicate selections must be handled consistently when sampling without replacement. Substituting an easier-to-contact person for a selected nonrespondent breaks the original mechanism. Preserve selection records so that the design can be audited.
Use stratified sampling for representation and precision
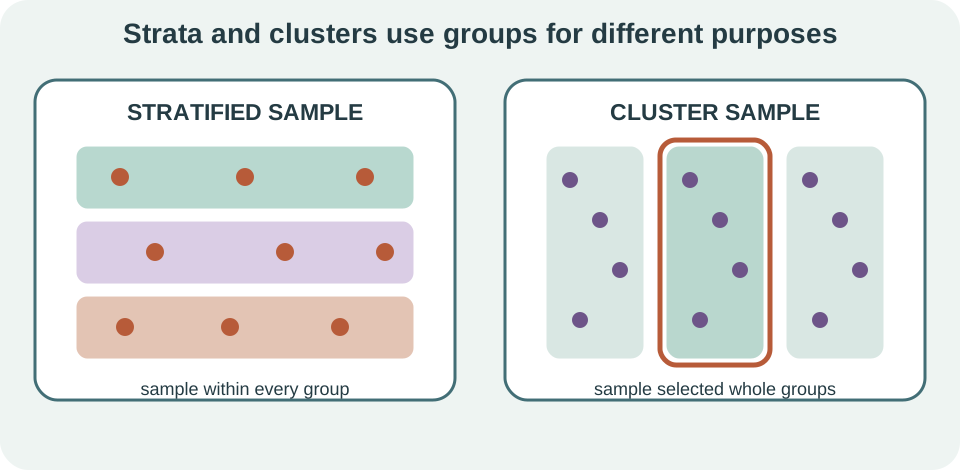
In stratified random sampling, the population is divided into nonoverlapping groups called strata, and a probability sample is selected independently within every stratum. Strata often reflect characteristics important to representation or response variation, such as grade level, region, or age group. Every population unit should belong to exactly one stratum. The design guarantees sampled observations from each included stratum. It can also improve precision when units within strata are relatively similar.
If sampling fractions differ across strata, an unweighted sample mean may not represent the population mean. Let stratum contain population size and sample estimate . A population-weighted estimate is , where . The weight is the stratum’s population share. Weights must reflect the actual design and target.
Proportional allocation samples each stratum roughly in proportion to its population size. Disproportionate allocation may oversample a small group to obtain adequate subgroup precision. Oversampling is not inherently biased when correct weights and variance methods are used. It is a deliberate design choice. Reporting should distinguish raw sample composition from weighted population estimates.
Distinguish cluster and multistage sampling
In cluster sampling, the population is divided into natural groups, a random sample of clusters is selected, and many or all units within selected clusters are observed. Schools, city blocks, clinics, and production batches can serve as clusters. The method reduces travel or listing cost when units are geographically or administratively grouped. Unlike strata, clusters are ideally miniature mixtures of the population rather than internally homogeneous groups. The practical design often trades precision for efficiency.
Observations within a cluster tend to resemble one another. Students in the same school share policies and environment, while items in one batch share production conditions. This intracluster correlation reduces effective independent information. Treating all individuals as independent usually understates uncertainty. Analysis must reflect the cluster selection and dependence.
Multistage sampling selects units through several probability stages. A national survey might sample regions, then neighborhoods within regions, then households within neighborhoods, and finally one person within each household. Selection probabilities multiply across stages. Weights often equal the reciprocal of overall inclusion probabilities before adjustments. Complex designs require variance methods that preserve strata, clusters, and stages.
Use systematic sampling carefully
A systematic sample orders the frame, chooses a random start, and selects every th unit. If the population size is near and desired sample size is , the interval is approximately . The random start should be selected from the first interval. This method can spread the sample across a long ordered list. It is often easier to implement than independent random selections.
Systematic sampling can perform well when list order is unrelated to the measured outcome or helps distribute coverage. It can fail when periodic structure aligns with the interval. Sampling every seventh record could repeatedly select the same weekday in a daily sequence. A hidden pattern can then create severe bias or loss of precision. Inspect how the frame was ordered before choosing .
A single random start does not make every possible size- subset equally likely, so systematic sampling is not generally a simple random sample. It is its own probability design. Variance estimation depends on the implementation and ordering. Multiple random starts or explicit systematic-design methods may be needed. Name the actual design rather than using “random sample” as a generic label.
Separate sampling variability from sampling bias
Sampling variability is natural change in a statistic across repeated probability samples. Two well-drawn random samples rarely produce identical means or proportions. Larger independent samples generally reduce this variability. Standard errors quantify it under a specified design and model. Confidence intervals use that quantified fluctuation.
Bias is systematic tendency for a procedure to miss the target in one direction or according to a persistent pattern. A convenience sample may overrepresent accessible people. A leading survey question may shift answers. A faulty instrument may record every mass too high. Repeating biased measurements more often can estimate the wrong target with great precision.
The distinction explains why sample size is not a universal cure. Increasing narrows random fluctuation under appropriate sampling. It does not automatically repair undercoverage, nonresponse, response bias, confounding, or measurement error. A very large biased dataset can yield narrow but misleading intervals. Design quality and sample size address different threats.
Identify nonresponse and response bias
Nonresponse occurs when a selected unit does not provide usable data. Unit nonresponse affects an entire questionnaire or record, while item nonresponse affects particular variables. Bias arises when response propensity relates to the outcome after accounting for available adjustment information. A low response rate raises concern but does not alone determine bias magnitude. Differences between respondents and nonrespondents matter most.
Follow-up contacts, multiple response modes, shorter instruments, and accessible language can improve participation. Weighting classes or response-propensity adjustments may reduce known imbalance. Imputation can fill missing values for analysis while reflecting uncertainty. None of these steps guarantees removal of bias from unmeasured differences. Prevention is generally stronger than post hoc correction.
Response bias occurs when recorded answers systematically differ from the intended quantities. Wording, question order, interviewer behavior, memory limitations, social desirability, and mode can all contribute. Neutral wording and pilot testing help detect problems. Anonymous collection may improve honesty for sensitive topics. Measurement design deserves the same rigor as selection design.
Understand convenience and voluntary-response samples
A convenience sample selects units because they are easy to access. Surveying people leaving one building, using one class, or analyzing available platform users may be convenient. Such samples can support exploratory or local descriptions. They generally lack known inclusion probabilities for a broad target population. Formal generalization beyond observed cases therefore requires strong unverified assumptions.
A voluntary-response sample allows people to choose whether to participate after a broad invitation. Individuals with strong opinions, unusual experiences, or more available time may respond at higher rates. Online polls and call-in surveys commonly display this pattern. Large participation does not remove self-selection. The responding group can differ systematically from the target population.
These data are not worthless, but their scope must be stated honestly. They may reveal possible mechanisms, generate hypotheses, or describe participants. They should not be presented as probability estimates for an unsupported population. Model-based adjustment can help only when relevant selection variables are measured and assumptions are credible. Transparency is preferable to false representativeness.
Distinguish observational studies and experiments
An observational study measures exposures, characteristics, and outcomes without assigning the explanatory condition. Cohort, case-control, and cross-sectional studies are observational even when carefully planned. They can estimate associations and temporal patterns. They may adjust for measured confounders. Unmeasured confounding and selection can still limit causal interpretation.
An experiment deliberately assigns treatments to experimental units. The treatment is the explanatory condition manipulated by investigators. The response is measured after or during assignment according to a protocol. Experiments can support causal comparison when assignment, adherence, measurement, and interference assumptions are credible. Simply observing people who chose different treatments is not random assignment.
Ethical and practical constraints determine which questions can be randomized. Harmful exposures cannot be assigned merely for stronger inference. Natural experiments and quasi-experiments can sometimes exploit external assignment mechanisms. Their causal strength depends on specific design assumptions. “Experimental” and “observational” are starting classifications rather than complete quality judgments.
Separate random sampling from random assignment
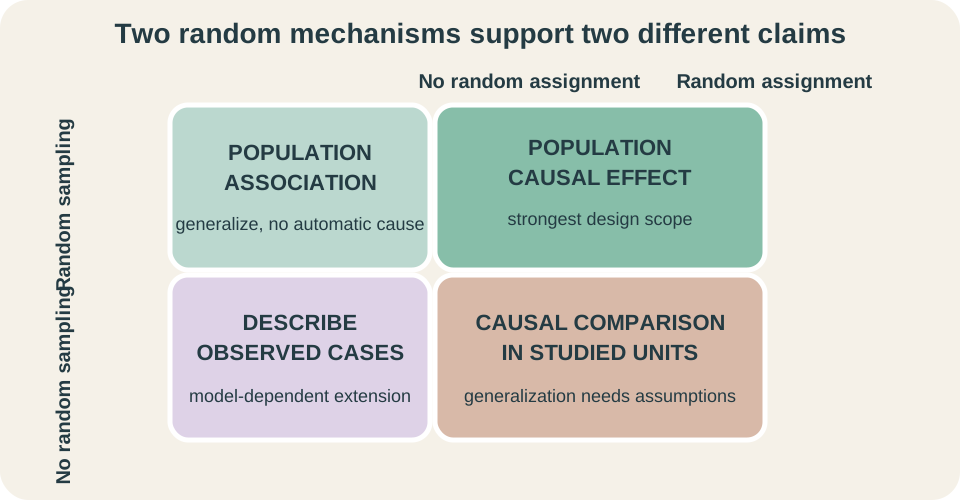
Random sampling selects units from a population and supports generalization to that population. Random assignment allocates sampled or recruited units to treatments and supports causal comparison among those units under the experimental conditions. A study may use one, both, or neither. The two probability mechanisms occur at different stages. Confusing them produces conclusions broader than the design allows.
Consider student volunteers randomly assigned to two study methods. Random assignment can support a causal comparison between methods for units like those studied under the protocol. Because volunteers were not randomly sampled from all students, direct population generalization is limited. The study has internal causal strength but uncertain external scope. A larger volunteer group would not create random sampling.
If a probability sample is observed without treatment assignment, population association may be estimated but causation remains unsupported. If a probability sample is also randomly assigned, both population generalization and causal inference may be supported within design and implementation limits. If neither mechanism exists, conclusions usually remain descriptive or model-dependent. A two-axis design map makes these possibilities explicit. Locating a study on that map is an efficient first step in writing its conclusion.
Apply the principles of experimental design
Comparison requires relevant treatment groups observed under similar conditions. Without a comparator, changes over time may reflect background trends, regression to the mean, or measurement effects. A control group may receive standard care, placebo, or no intervention when ethical. The appropriate comparator depends on the question. Every contrast should be defined before analysis.
Random assignment uses chance to allocate treatments. In the long run, it balances both measured and unmeasured pre-treatment characteristics probabilistically. One realized experiment can still show imbalance by chance. Randomization supports a reference distribution for treatment comparisons. It does not guarantee perfect equality of groups or correct measurement.
Replication applies treatments to enough independent experimental units to estimate variability and detect meaningful effects. Repeated measurements on one unit are not substitutes for independent unit replication. Control keeps other conditions as similar as practical. Blocking groups similar units before randomization to remove predictable variation. These principles work together rather than as isolated checklist items.
Use blocking, matching, and paired designs
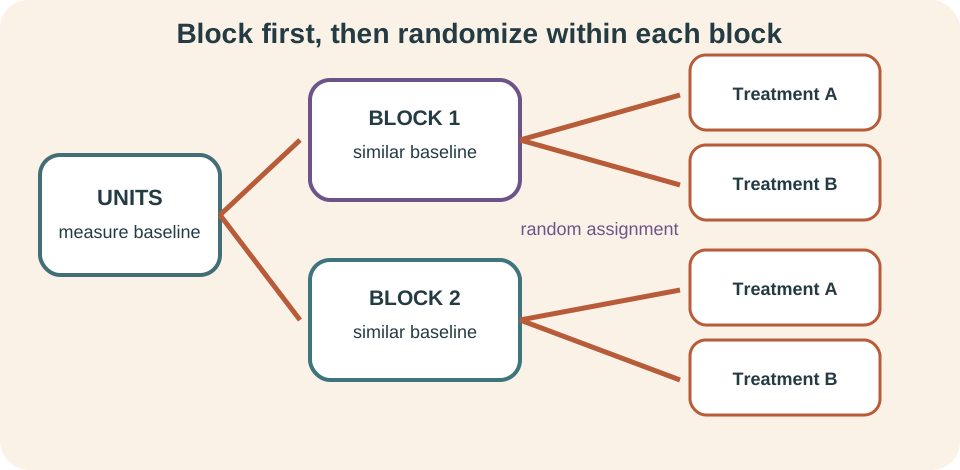
A block contains experimental units expected to respond similarly because of a known pre-treatment characteristic. Treatments are randomized within each block. This ensures local treatment comparison among comparable units. Blocks might be schools, age categories, baseline-risk groups, or production shifts. Effective blocking reduces unexplained variation and can improve precision.
A matched-pairs design is a special block design. Each block contains two closely matched units receiving different treatments, or one unit receives both treatments in randomized order when carryover can be controlled. The analysis focuses on within-pair differences. Shared pair characteristics cancel from the comparison. The pair, not each measurement independently, is the primary unit of variation.
Blocking differs from cluster assignment. Blocking deliberately distributes treatments within groups, while cluster randomization assigns whole groups to treatments. Cluster randomization may be necessary when individual assignment causes contamination or is operationally impossible. It reduces the number of independent assignment units and requires cluster-aware analysis. Similar group words can hide opposite design roles.
Use blinding, masking, and placebo controls
Blinding, also called masking, conceals treatment assignment from people whose knowledge could influence behavior or measurement. Participants may change expectations or adherence if they know treatment. Outcome assessors may classify ambiguous responses differently. Analysts may make subjective choices after seeing labels. Different roles can therefore require separate masking plans.
A placebo resembles the active intervention without its hypothesized active component. It helps control expectations, contact, and treatment ritual. Placebos are not appropriate or feasible for every intervention. An active comparator may be ethically required when effective standard treatment exists. The control condition should isolate the treatment contrast actually under study.
Terms such as “double blind” can be ambiguous because they do not identify which two groups were blinded. A stronger report names participants, caregivers, assessors, investigators, or analysts explicitly. Blinding does not fix allocation problems, attrition, nonadherence, or poor outcome validity. It addresses particular behavioral and measurement pathways. Design features should be connected to the biases they are intended to reduce.
Recognize confounding and lurking variables
Confounding occurs when effects of explanatory variables cannot be separated in the observed comparison. In an observational study, exercise and health outcome may be confounded by baseline health, income, age, or access to care. Statistical adjustment can address measured variables under modeling assumptions. It cannot guarantee control of unmeasured confounders. Association after adjustment is not automatically causal.
Random assignment helps prevent systematic confounding by making treatment allocation independent of pre-treatment characteristics under the assignment mechanism. It does not prevent post-assignment issues such as differential dropout, nonadherence, or treatment contamination. Conditioning on variables affected by treatment can introduce new bias. Analysis must respect the timeline of cause and measurement. Preserving the assigned-group comparison often protects the benefit of randomization.
A lurking variable is an unmeasured or omitted factor related to the observed association. The phrase is descriptive rather than a complete causal analysis. Directed causal diagrams can clarify assumed pathways and adjustment choices. Subject-matter knowledge is necessary to identify plausible confounders. No significance test proves that all confounding has been removed.
Respect interference and the unit of assignment
Standard causal comparisons often assume one unit’s outcome depends only on its own assigned treatment, not on assignments received by other units. This condition is called no interference within a broader stable-treatment framework. It can fail in infectious disease, education, social networks, and shared workplaces. One person’s treatment may protect, influence, or contaminate another. The treatment contrast must then account for exposure patterns.
Cluster randomization can reduce interference across individual treatment conditions within groups. Schools, villages, or clinics may be assigned as whole units. The number of clusters, not the number of individuals alone, drives independent assignment information. With only a few clusters, apparent sample size can be misleading. Design and analysis must use the assignment unit.
Treatment versions can also vary. “Receive counseling” may represent different counselors, durations, adherence levels, or delivery modes. If these versions affect outcomes, the assigned treatment label is not one uniform intervention. Protocol definition and implementation fidelity matter. Causal interpretation requires knowing what was actually contrasted.
Address ethics and feasibility
Statistical efficiency does not override participant welfare. Informed consent, privacy, risk minimization, fair selection, and independent review shape permissible designs. Vulnerable populations require additional safeguards. Withholding effective treatment may be unethical. Data collection should answer a meaningful question with no more burden than necessary.
Equipoise means genuine uncertainty about which treatment is better within the relevant expert community. It provides one ethical basis for randomization. Monitoring plans may stop a trial early for clear benefit, harm, or futility. Such rules should be specified in advance because repeated looks affect inference. Safety decisions and statistical operating characteristics must be coordinated.
Feasibility also shapes design. Recruitment, cost, treatment delivery, instrument capacity, and follow-up can limit ideal plans. A smaller well-controlled study may be more informative than a larger poorly implemented one. Pilot studies test procedures but are rarely powered for definitive effects. Design tradeoffs should be stated rather than hidden.
Match conclusions to the design
Random sampling without random assignment can support population association but not automatic causation. Random assignment without random sampling can support causal comparison for the studied units or a carefully defined similar population, but broad generalization requires assumptions. Both mechanisms together provide the strongest path to population causal claims. Neither mechanism calls for narrow descriptive language. The conclusion should mirror the design cell.
Scope also depends on implementation. Nonresponse can weaken a probability sample. Differential attrition can weaken a randomized comparison. Nonadherence changes the interpretation of assignment versus treatment received. Measurement validity determines what outcome was actually learned about.
Inference methods must match the design. Survey weights and complex-design variance estimators reflect unequal sampling and clustering. Randomization-based analyses reflect treatment assignment. Clustered standard errors or multilevel models may reflect dependence. A conventional independent-observation calculation cannot substitute for the correct mechanism.
Diagnose common design mistakes
Calling every use of a random-number generator “random sampling” is incorrect. Random assignment may use chance without selecting from a population. Conversely, a random sample can be purely observational. State exactly what was randomized and at which stage. This wording prevents causal and population claims from being conflated.
A large convenience sample is not necessarily representative. Undercoverage and self-selection can persist as sample size grows. Treating repeated observations on one person as independent replication inflates apparent information. Ignoring cluster dependence does the same. Count independent selection or assignment units, not just rows.
Other mistakes include claiming causation from association, assuming a nonsignificant difference proves treatments equivalent, and treating blinding as a cure for confounding. Equivalence requires a margin and appropriate procedure. Blinding addresses awareness-related pathways, while assignment addresses confounding. Every design feature has a specific purpose. No single feature repairs every weakness.
Practice design recognition and repair
A school wants representation from every grade level. Choose a sampling design and explain its chance mechanism. State whether grade should be treated as a stratum or a sampled cluster. Explain how estimates should be combined if smaller grades are oversampled. Identify the target population and frame. Name one possible coverage problem.
A study randomly assigns volunteers to two study methods. State the causal and population conclusions supported. Identify experimental units, treatments, response, and assignment mechanism. Propose one blocking variable and explain why it might improve precision. Identify one potential interference pathway. Explain what random assignment does and does not guarantee.
An online news site invites all readers to answer a policy poll and receives responses. Classify the sample. Explain why size does not eliminate selection bias. Propose a probability-based alternative with a defined frame. Identify one remaining nonresponse concern. State the narrow conclusion the original poll can safely support.
Solutions and reasoning
Use stratified random sampling by grade, selecting a probability sample independently within every grade. Grade is a stratum because every grade is represented, rather than a cluster sampled as an intact group. If sampling fractions differ, combine grade estimates using population-size weights . The target might be all currently enrolled students, with the enrollment roster as frame. Students missing or duplicated in that roster create coverage problems.
Random assignment supports a causal comparison of study methods for the volunteers under the study conditions. Volunteer recruitment does not support automatic generalization to all students. Experimental units are students, treatments are study methods, and the response might be a defined assessment score. Baseline achievement could be a blocking variable. Students sharing materials across assigned methods could create interference, and chance assignment does not guarantee perfect realized balance or broad representativeness.
The poll is a voluntary-response sample. People who visit, notice, and choose to answer can differ systematically from the target population, regardless of response count. A probability alternative could sample registered voters from a current voter frame with known selection probabilities. Selected individuals may still fail to respond, creating possible nonresponse bias. The original poll safely describes the recorded answers of participating site readers rather than all voters.
Carry design thinking into inference
Confidence intervals and hypothesis tests quantify uncertainty only relative to a data-generating mechanism and assumptions. Random sampling provides one mechanism for sample-to-population inference. Random assignment provides another for treatment comparison. Complex designs modify weights, degrees of freedom, and variance. Analysis begins with reconstructing how the data came to exist.
Regression can adjust for measured differences, but it does not retroactively randomize treatment or repair an unknown frame. Larger samples reduce some forms of variability but can amplify confidence in biased estimates. Sophisticated software cannot recover information excluded by design. Prevention is usually more powerful than correction. Design is therefore part of statistical reasoning, not a prelude to it.
Keep the scope map visible in every report. Define the population, frame, sampling unit, experimental unit, assignment unit, treatment, and response. Describe chance mechanisms, missingness, dependence, blinding, and implementation. State causal and generalization claims separately. Rigorous conclusions are those whose reach matches the evidence-producing design.