
A reaction equation states the net change from reactants to products, but it usually does not reveal how bonds reorganize along the way. Reacting particles must follow a molecular pathway through configurations that can require substantial energy and precise orientation. The energy barrier along that pathway helps explain why some thermodynamically favorable reactions are slow. A reaction mechanism proposes a sequence of elementary molecular events whose sum reproduces the observed net equation. Kinetics tests that proposal through rate laws, temperature dependence, intermediates, and experimental intervention.
You will interpret reaction-coordinate diagrams, distinguish activation energy from reaction energy, use the Arrhenius equation, connect temperature with the fraction of energetic collisions, and analyze elementary-step mechanisms. You will identify intermediates and catalysts by cancellation, relate molecularity to elementary rate laws, and test a proposed mechanism against overall stoichiometry and observed kinetics. Every exponential, logarithm, reciprocal temperature, and energy unit will be explained. Catalysts will be treated as alternate pathways rather than as energy sources. The goal is to understand a mechanism as an evidence-constrained model rather than a story invented from the net equation.
Begin with three separate questions. Is the overall reaction thermodynamically favorable under the conditions, how quickly does it occur, and by what sequence of molecular changes does it proceed? Draw or read the energy pathway, then distinguish initial-to-final energy difference from the barrier height. For a proposed mechanism, sum the steps, cancel intermediates and catalysts correctly, and derive or justify the rate behavior. A mechanism is credible only when all available evidence is consistent with it.
Thermodynamic favorability and kinetic accessibility differ
Thermodynamics compares initial and final states and predicts a direction or equilibrium tendency under specified constraints. Kinetics describes reaction rate and the molecular pathway that produces change. A negative Gibbs free-energy change can favor products while a large activation barrier makes the transformation extremely slow. Diamond’s conversion toward graphite under ordinary conditions is a familiar conceptual example. Favorability does not guarantee an observable timescale.
Conversely, an externally driven process can proceed rapidly in a direction that is not spontaneous for the isolated chemical system. Electrical work drives electrolysis, and light can drive photochemical reactions. The energy source changes the conditions and pathway. Rate observations alone therefore do not establish the sign of . Direction, rate, and mechanism are related but distinct dimensions.
The net equation suppresses these distinctions. may occur in one elementary collision, through several intermediates, on a surface, or through a radical chain. All routes share the same atom ledger but can have different barriers and rate laws. Kinetic experiments discriminate among routes. Stoichiometry alone cannot uniquely reconstruct molecular history.
Activation energy is a pathway barrier
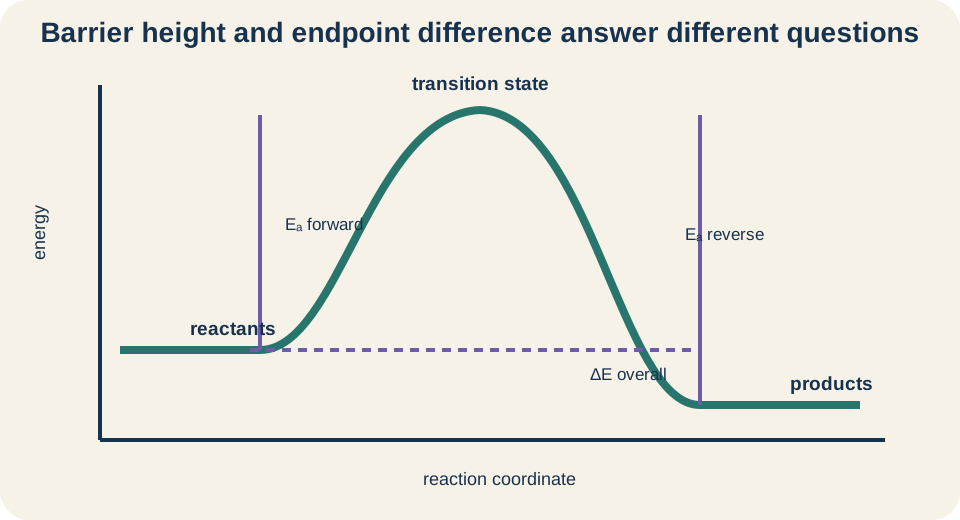
Activation energy is the energy difference between reactants and the relevant transition-state region along a specified pathway. A transition state is a fleeting high-energy configuration near the top of the barrier. It is not generally isolated as a stable bottleable substance. Bonds may be partially broken and partially formed. The symbol often uses units for a molar barrier.
On a reaction-coordinate diagram, the vertical axis represents potential-energy-like or free-energy-like quantity depending on the diagram, while the horizontal axis represents progress along a pathway rather than clock time. The forward activation energy is measured vertically from reactants to the peak. The reverse activation energy is measured from products to the same peak for a one-step path. The overall reaction energy is measured from reactants to products. These vertical differences answer different questions.
For an exothermic one-step energy diagram, products lie below reactants. The reverse activation energy then exceeds the forward activation energy by the magnitude of the reaction energy. For an endothermic diagram, products lie above reactants and the forward barrier exceeds the reverse barrier. Changing product energy without changing the peak changes both overall energy and one barrier relation. Reading all measurements from a common vertical scale prevents sign errors.
Collisions need energy and orientation
Collision theory proposes that reacting particles must encounter one another with sufficient energy and suitable orientation. Collision frequency grows with concentration or gas pressure because more particles occupy the reaction volume. Yet most collisions may still be ineffective. Energy must access configurations that allow bond rearrangement. Molecular geometry determines whether the right atoms meet in a productive orientation.
Activation energy does not mean every collision must have total energy greater than a rigid classical wall in one coordinate. Real molecular energy is distributed among translation, rotation, vibration, and electronic structure, and reaction dynamics can be complex. The barrier model compresses that complexity into a useful rate relationship. It predicts trends without tracing every quantum trajectory. The word “effective collision” summarizes multiple requirements.
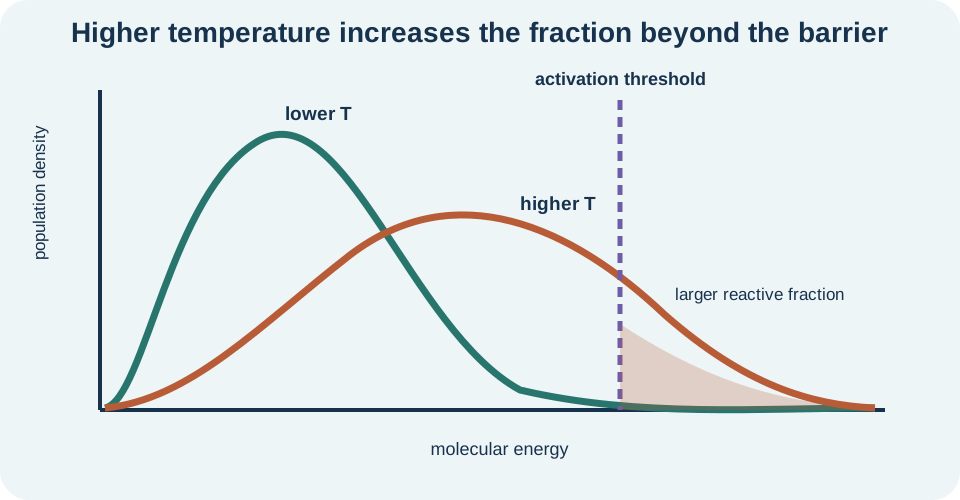
Increasing temperature shifts the energy distribution so a larger fraction of particles can access the barrier region. Collision frequency may also rise modestly because particles move faster, but the dramatic rate increase often comes mainly from the exponential change in the energetic fraction. This is why a small temperature increase can produce a much larger rate change. The Arrhenius equation quantifies that sensitivity in a common empirical model. Orientation and mechanism remain part of the prefactor.
The Arrhenius equation models temperature dependence
The Arrhenius equation is . The symbol is the rate constant, is the pre-exponential or frequency factor, is the base of natural logarithms, is activation energy, is the gas constant, and is absolute temperature. The exponent must be dimensionless. Therefore and must use compatible molar energy units. The prefactor carries whatever units the reaction’s rate law requires for .
Using requires in and in kelvins. If activation energy is reported as , convert it to . Moles and joules cancel in , and kelvins cancel as well. A Celsius temperature cannot be substituted because reciprocal absolute temperature appears. Unit cancellation validates the exponent.
As increases, the positive denominator increases, so the negative exponent becomes less negative. The exponential factor therefore grows, increasing when and are treated as constant. A larger activation energy makes the exponent more negative at fixed temperature, reducing . The exponential dependence explains strong temperature sensitivity. The parameters can themselves vary over broad ranges, so Arrhenius linearity should be tested rather than assumed universally.
Linearize Arrhenius behavior with logarithms
Taking the natural logarithm gives . This has the linear form when , , intercept , and slope . A graph of versus reciprocal kelvin temperature should be approximately linear under the model. The negative slope reflects larger rate constants at higher temperature, which corresponds to smaller . Axis definitions are essential.
If a fitted slope is , then . Multiplying gives . This is . Kelvin cancels, leaving molar energy. The sign becomes positive because the fitted slope is negative.
Curvature in an Arrhenius plot can indicate changing mechanism, temperature-dependent prefactor, transport limitation, or other model failure. Scatter can arise from experimental uncertainty in rates and temperature. A straight line supports but does not uniquely prove one mechanism. Residuals and the temperature range should be reported. Linearization is a diagnostic transformation, not a guarantee of causality.
The two-temperature form avoids finding A
Subtracting logarithmic Arrhenius equations at temperatures and gives . The pre-exponential factor cancels if it is treated as constant across the interval. The left side is dimensionless because it is a ratio of rate constants with the same units. The right side is dimensionless by energy and temperature cancellation. This form compares two measurements directly.
If , then , making the parenthetical difference negative. The leading negative sign makes the right side positive for positive . Therefore , which means . Sign analysis predicts the result before calculation. A computed ratio below one under these conditions signals an input or algebra error.
Rearranging can estimate from two rate constants, but two points cannot reveal curvature. Multiple temperatures and regression provide stronger evidence. Temperature uncertainty can have substantial effect because reciprocal temperature enters the equation. Use kelvins with adequate precision and avoid premature rounding. The model’s assumptions should accompany the numerical barrier.
A mechanism is a sequence of elementary steps
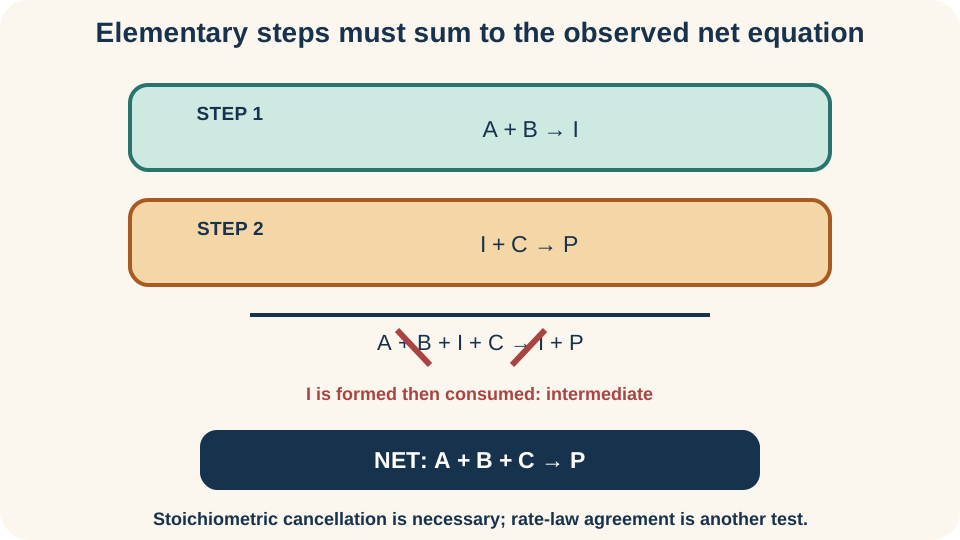
An elementary step represents one molecular event in the proposed mechanism. Its written stoichiometry describes the particles participating in that event. Adding all elementary steps and canceling species that appear on both sides must reproduce the balanced overall reaction. The mechanism can contain species absent from the net equation. Those hidden species can be intermediates or catalysts.
Consider two steps: followed by . Adding them gives . Cancel intermediate I from both sides to obtain . The overall reaction contains no I because it is produced and later consumed. Its transient concentration may still be measurable.
A proposed mechanism is not established merely because its steps sum correctly. Many invented sequences can reproduce the same net equation. The mechanism must also agree with observed rate laws, isotope effects, intermediate detection, product distributions, stereochemistry, and other evidence. Mechanistic science compares predictions with experiments. Cancellation is the first test, not the last.
Molecularity applies to elementary steps
Molecularity counts reacting particles in a single elementary event. A unimolecular step involves one reacting entity, a bimolecular step involves two, and a termolecular step involves three. Events involving many simultaneous particles are unlikely because precise multi-particle encounters are rare. Molecularity is always a positive integer for an elementary step. It is not assigned to a multistep overall equation.
For an elementary step , the mass-action rate form is under the simple model. For , it is . The exponents follow elementary stoichiometry because the event requires those particles together. This direct rule does not generally apply to overall coefficients in a multistep reaction. Experimental rate orders can be zero, fractional, or otherwise unlike net stoichiometry.
The word “order” describes concentration exponents in a rate law, while molecularity describes particle count in an elementary step. They coincide only under suitable elementary-step conditions. An observed second-order rate law can arise through more than one mechanism. Conversely, a complex mechanism can produce an apparent fractional order. Keeping the terms separate prevents mechanism claims from outrunning data.
Intermediates are formed and consumed
An intermediate is produced in one elementary step and consumed in a later step. It does not appear in the overall balanced equation after step addition. Its concentration can begin near zero, rise, and later fall or reach a low steady value during reaction. Intermediates may be radicals, ions, excited states, surface species, or molecular complexes. Their detection can strongly constrain possible mechanisms.
Intermediates differ from transition states. An intermediate corresponds to a local energy minimum and may have a finite lifetime long enough for observation or trapping. A transition state corresponds to a barrier-region maximum along a reaction coordinate and is not an ordinary isolable species. A multistep energy profile has one peak per elementary barrier and one valley for each intermediate. Counting peaks and valleys helps interpret the mechanism.
An intermediate should not appear in the final rate law if the law is expressed solely in stable reactants and catalysts unless its concentration is independently controlled or measured. Mechanistic derivations often eliminate it using a fast pre-equilibrium or steady-state approximation. These are model assumptions that need justification. Simply deleting an intermediate symbol from a rate law is not valid algebra. Its relationship to observable species must be derived.
Catalysts are consumed and regenerated
A catalyst participates in elementary steps but is regenerated by the end of the mechanism. If C is consumed in an early step and reformed later, it cancels when steps are added. Unlike an intermediate, a catalyst is present before the mechanism begins and is restored overall. Its concentration can appear in the rate law. Catalytic effectiveness depends on pathway and conditions.
A catalyst provides an alternate mechanism with a lower effective barrier or different sequence of barriers. It does not lower the energy of reactants and products relative to one another. Therefore it does not change the overall , , or equilibrium constant at fixed temperature. It accelerates forward and reverse approaches. Equilibrium is reached sooner but at the same composition under otherwise identical conditions.
A catalyst does not make every elementary step lower than every uncatalyzed step in a simplistic comparison. It changes the pathway, possibly adding more steps and intermediates. The largest kinetically influential barrier along the new route is lower in an appropriate free-energy sense. Catalysts can also improve selectivity by favoring one product pathway over competitors. Mechanistic detail explains performance better than the phrase “lowers activation energy” alone.
The slow-step approximation can suggest a rate law
In a mechanism with one much slower elementary step than the others, that step can limit the overall rate, much like a bottleneck. If the slow elementary step is , a proposed rate law may be . This works because the slow step directly involves stable reactants. The result must match experiment. A label of “slow” is a mechanistic hypothesis supported by kinetic behavior.
Suppose instead a fast pre-equilibrium precedes a slow step . The slow-step law is initially , but I is an intermediate. The pre-equilibrium relation can express in terms of A and B, yielding an observable-species law. This derivation can produce exponents reflecting earlier equilibria. The overall rate law is not read directly from the net equation.
Not every mechanism has a single clearly rate-determining step. Comparable barriers, changing conditions, reversibility, and intermediate accumulation can create more complex rate control. Modern analyses may use steady-state approximations, numerical integration, and sensitivity methods. The bottleneck picture is useful but conditional. Experimental agreement across conditions is the test.
Validate a mechanism with multiple independent tests
First sum the proposed steps and confirm the exact balanced overall equation. Every atom and total charge must be conserved. Intermediates and catalysts should cancel in the appropriate produced-consumed order. A missing species or wrong coefficient invalidates the mechanism immediately. This is the stoichiometric gate.
Second derive the predicted rate behavior under stated assumptions and compare it with the observed rate law. An overall law that depends on a species absent from the proposed rate-controlling sequence needs explanation. Temperature dependence should also be consistent with the pathway and any change of mechanism. A catalyst order, inhibition effect, or saturation behavior can offer additional tests. One matching exponent rarely proves uniqueness.
Third seek structural evidence. Detect or trap intermediates, use isotope labeling to trace atoms, measure kinetic isotope effects, compare stereochemical outcomes, or observe spectroscopic signatures. Perturbation experiments can reveal which species participate before the rate-limiting transition state. Computation can estimate energy profiles but must be compared with experiment. A mechanism gains credibility from converging evidence.
Energy profiles for multistep mechanisms
A multistep reaction-coordinate diagram contains a peak for each transition state and a valley for each intermediate. Reactants occupy the initial level, products the final level, and intermediates lie between successive peaks. Each elementary step has its own forward and reverse activation barrier. The highest plotted peak relative to the immediately preceding populated state is often kinetically important. However, full rate control depends on populations and network dynamics.
A catalyst changes the profile by providing a different path. The catalyzed profile may have more peaks but a lower highest effective barrier. Reactant and product energy levels remain the same for the same overall reaction conditions. Drawing the catalyzed curve with lower product energy would incorrectly imply changed thermodynamics. The endpoints belong to states, while peaks belong to paths.
Reaction enthalpy is not the same as activation energy. An exothermic reaction can have a large forward barrier, and an endothermic reaction can have a modest barrier under suitable pathways. The sign of describes endpoint difference. The magnitude of describes access to a transition region. Reading both from one diagram makes the distinction concrete.
Common errors and corrective habits
One common error measures activation energy from the horizontal axis rather than from the reactant energy level. Always measure vertical difference between the appropriate starting state and peak. Another error treats the reaction coordinate as time. It is a generalized progress variable without a fixed linear time scale. Label axes before extracting meaning.
A numerical error mixes activation energy with in . Convert units before forming the exponent. Another reverses the axes of an Arrhenius plot and then assigns slope incorrectly. For versus , slope is . A graph of different variables has a different slope meaning.
A mechanistic error reads the overall rate law directly from overall stoichiometric coefficients. Only an elementary-step law has that direct relationship. Another labels a transition state as an intermediate or a catalyst as an intermediate. Use energy minima and before/after presence to distinguish them. Finally, demand both net-equation and kinetic agreement before accepting a mechanism.
Guided practice and retrieval
For an Arrhenius plot with slope , calculate the activation energy. Use , where is slope. Multiplication gives . This is . The positive barrier is consistent with the negative slope.
Consider steps and . Adding and canceling one and one from opposite sides gives . is an intermediate because it is formed then consumed. One participates and is regenerated relative to the first occurrence, but another net remains reactant. Careful coefficient cancellation determines roles.
Explain a catalyst’s effect in three separate statements. It supplies an alternate mechanism and changes activation barriers. It increases rates of approach in both directions. It does not change equilibrium constant or overall state-function differences at fixed temperature. Keeping these statements separate prevents the common false claim that a catalyst “adds energy” or “makes more product” at equilibrium.
Connection forward
Reconstruct the framework without looking back. Distinguish thermodynamic favorability, activation barrier, rate, and mechanism. Explain every symbol in the Arrhenius equation and the slope of its linear plot. Define elementary step, molecularity, intermediate, transition state, catalyst, and slow-step approximation. Then list the independent tests a mechanism must pass.
Dynamic equilibrium will combine forward and reverse mechanisms at equal macroscopic rates. Catalysts will shorten the approach to that state without moving its composition. Statistical mechanics will refine the distribution and barrier picture, while transition-state theory will relate activated configurations to rate constants. Enzyme kinetics will add binding, saturation, and catalytic cycles. Atmospheric and combustion chemistry will use radical-chain mechanisms with many coupled steps.
The enduring insight is that pathways matter. Identical reactants and products can be connected by routes with very different barriers, rates, intermediates, and selectivities. Temperature changes how populations access barriers, and catalysts create alternate routes without changing endpoint thermodynamics. Mechanisms remain hypotheses constrained by stoichiometry and experiment. Kinetics becomes explanatory when equations, energy profiles, and evidence all tell the same molecular story.